
Data Cleanup, Integration & QA/QC
Clean, standardize, validate, and connect messy project data so it becomes reliable, usable, and ready for mapping, analysis, reporting, dashboards, or automation.
What This Service Helps with
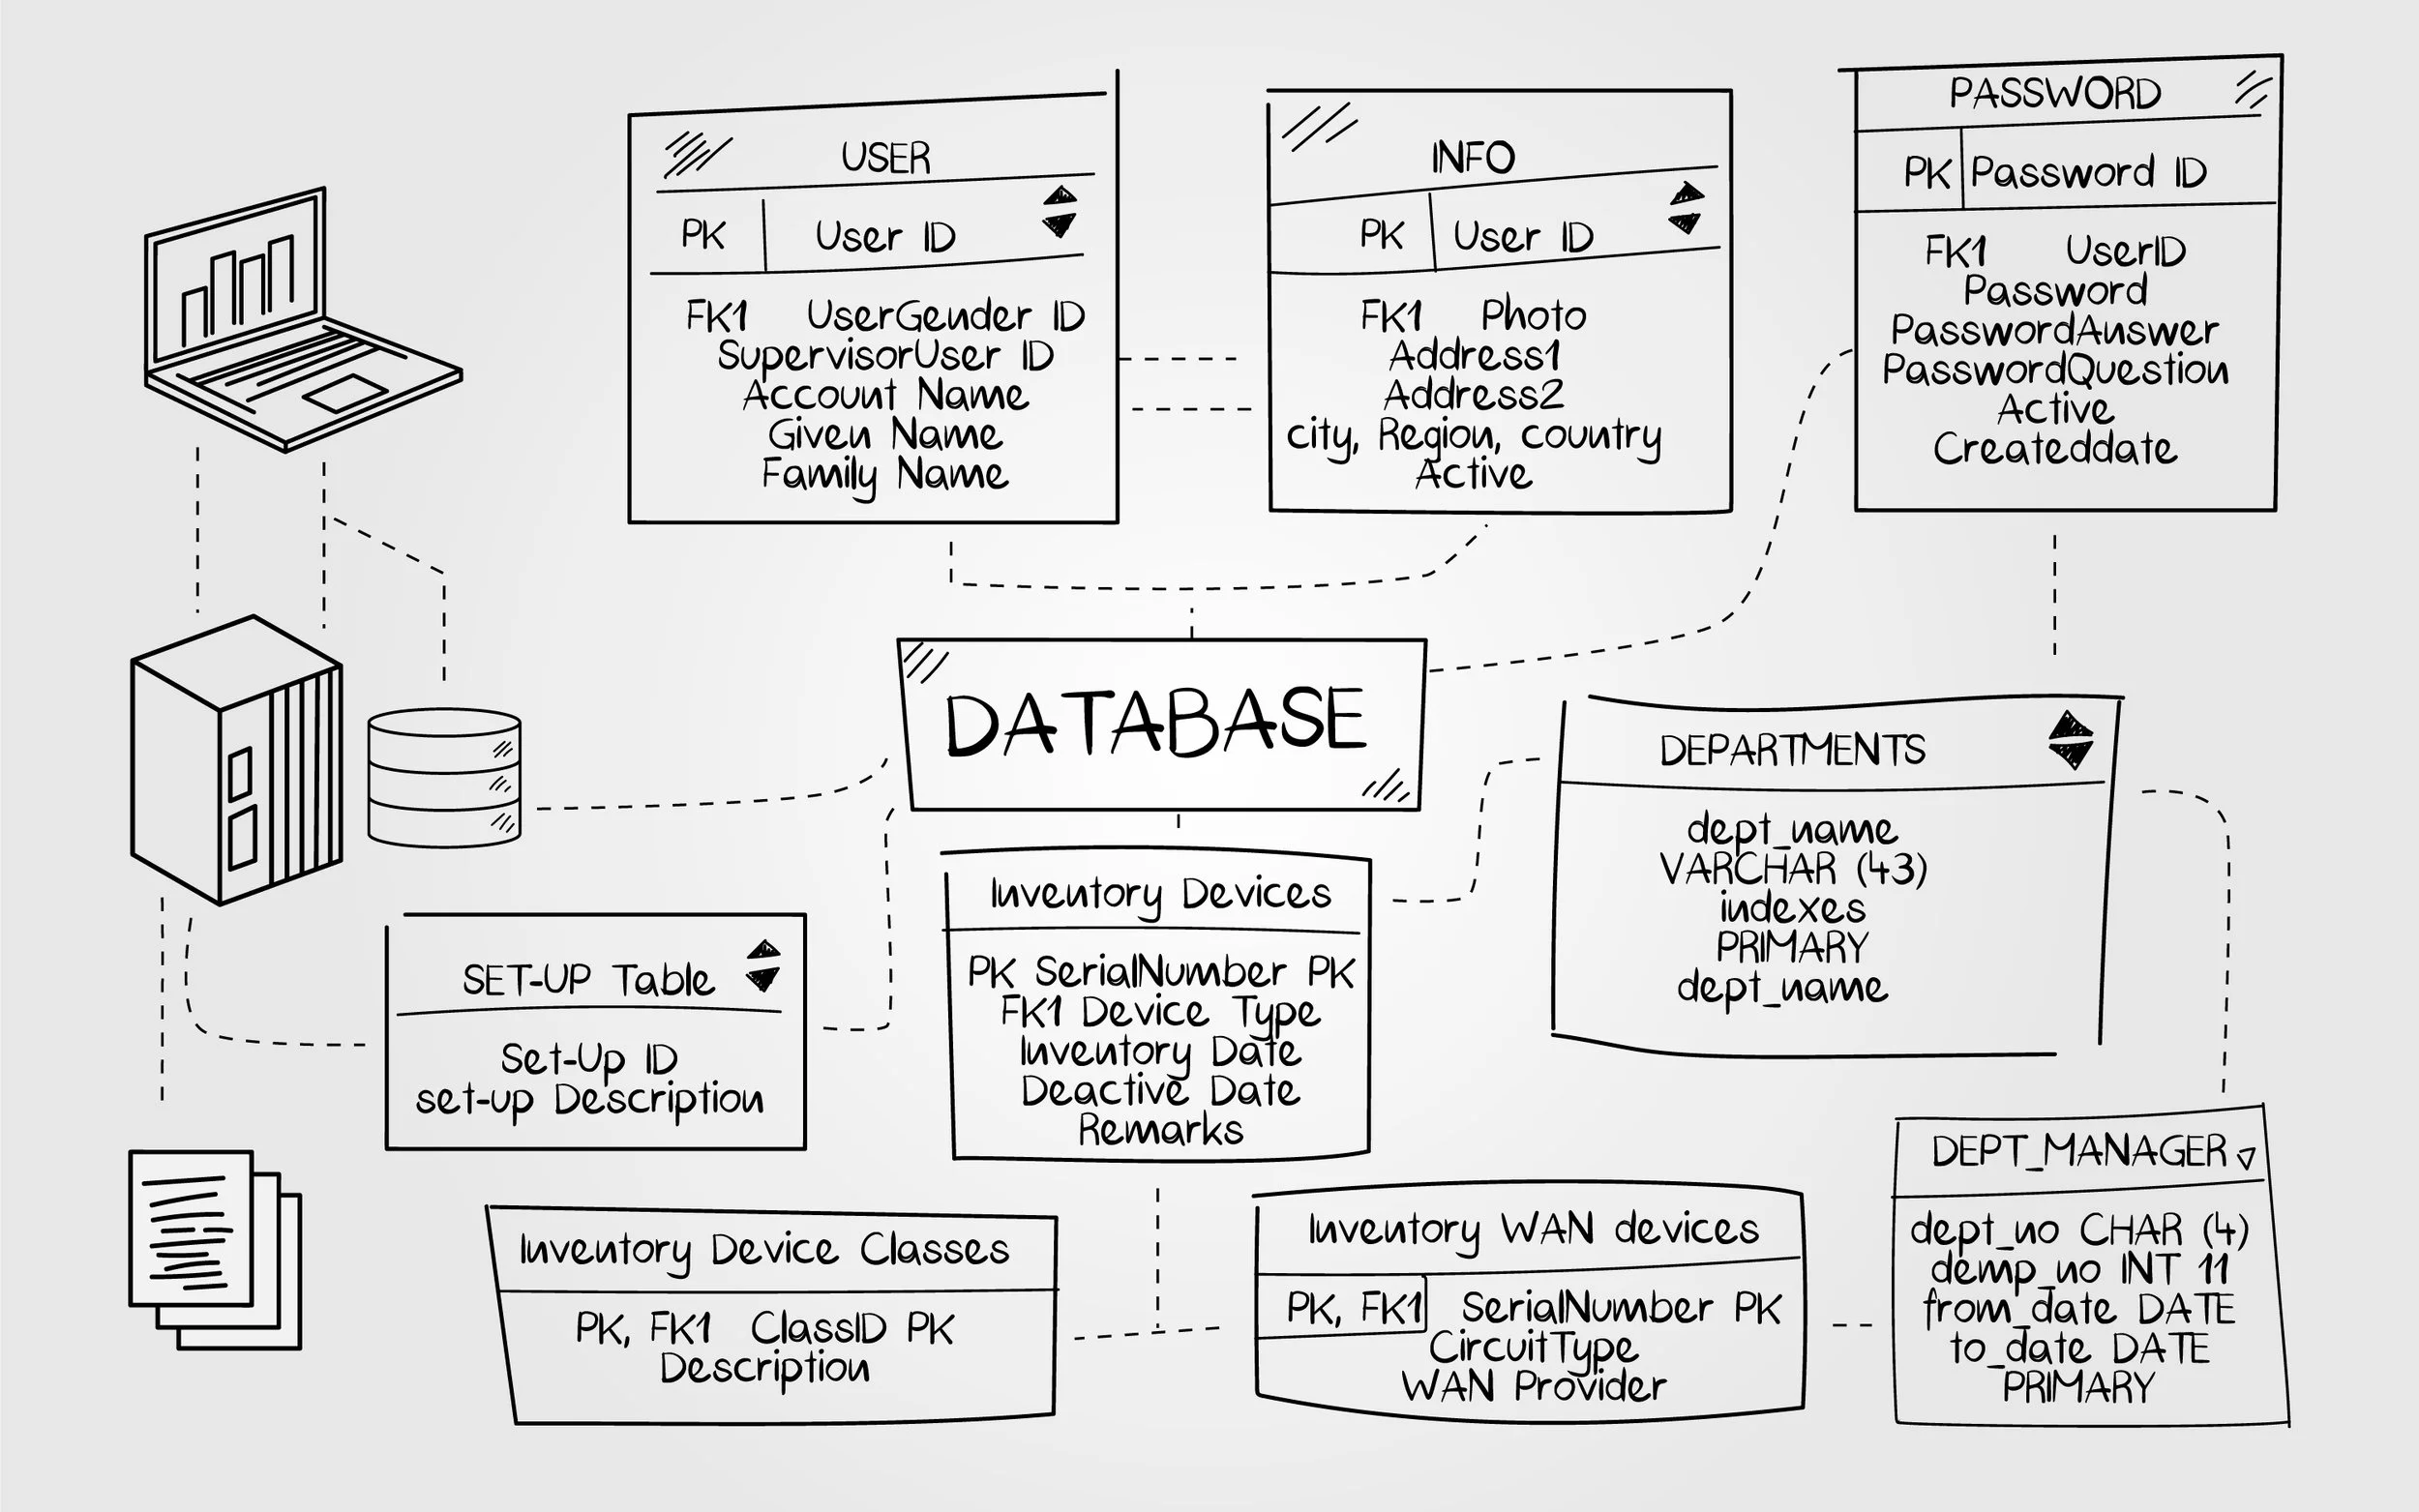
Project data is often spread across spreadsheets, GIS layers, databases, CAD files, field forms, reports, and legacy systems. Field names may be inconsistent, records may be duplicated, coordinates may be missing, geometries may be invalid, and important information may not join cleanly.
OrbitalIQ helps turn messy spatial and tabular data into structured, review-ready datasets that project teams can trust and use.
This is useful when your team needs to:
Clean messy spreadsheets, GIS layers, or project tables
Standardize fields, naming, codes, categories, and attributes
Identify missing, duplicate, invalid, or conflicting records
Join spatial and non-spatial datasets together
Prepare data for dashboards, web maps, reporting, or analysis
Create a clear QA/QC trail before project delivery
Typical Deliverables
Cleaned GIS layers
Standardized spreadsheets or tables
QA/QC issue logs
Duplicate and conflict review tables
Joined spatial and tabular datasets
Validated geodatabases
Geometry repair outputs
Field mapping and data dictionaries
Dashboard-ready datasets
Before-and-after summaries
Review-ready Excel outputs
Documentation and handoff notes
Core Support Areas
-
Clean inconsistent fields, naming conventions, date formats, categories, codes, units, null values, duplicate records, and incomplete attributes so datasets are easier to use and maintain.
-
Review GIS layers for geometry issues, missing attributes, duplicate features, gaps, overlaps, invalid polygons, projection problems, and features that do not align with expected project rules.
-
Connect spreadsheets, GIS layers, lookup tables, field data, asset records, and project databases using clean keys, spatial joins, attribute joins, or structured data models.
-
Identify duplicate records, mismatched values, conflicting attributes, and cases where records need review before they can be trusted for mapping, reporting, or decision-making.
-
Prepare clean source data for dashboards, indicators, charts, tables, web maps, and reporting workflows so the final outputs are accurate and easier to maintain.
-
Create clear summaries of what was cleaned, what was changed, what still needs review, and which records were flagged for follow-up.
Example Use Cases
Spreadsheet to GIS Cleanup
Clean and standardize Excel or CSV data so it can be joined to GIS layers, mapped, reviewed, or used in dashboards.
Parcel & Asset Data Review
Review parcel, infrastructure, building, utility, or asset datasets for missing values, duplicate records, geometry issues, and inconsistent attributes.
Field Data QA/QC
Check field-collected records for missing photos, incomplete forms, invalid coordinates, inconsistent categories, or records requiring follow-up.
Dashboard Data Preparation
Prepare clean, structured datasets that can drive dashboard indicators, charts, lists, filters, maps, and reporting views.
Multi-Source Data Integration
Combine data from GIS layers, spreadsheets, databases, web services, CAD files, and field apps into a single usable project structure.
Related Project Examples
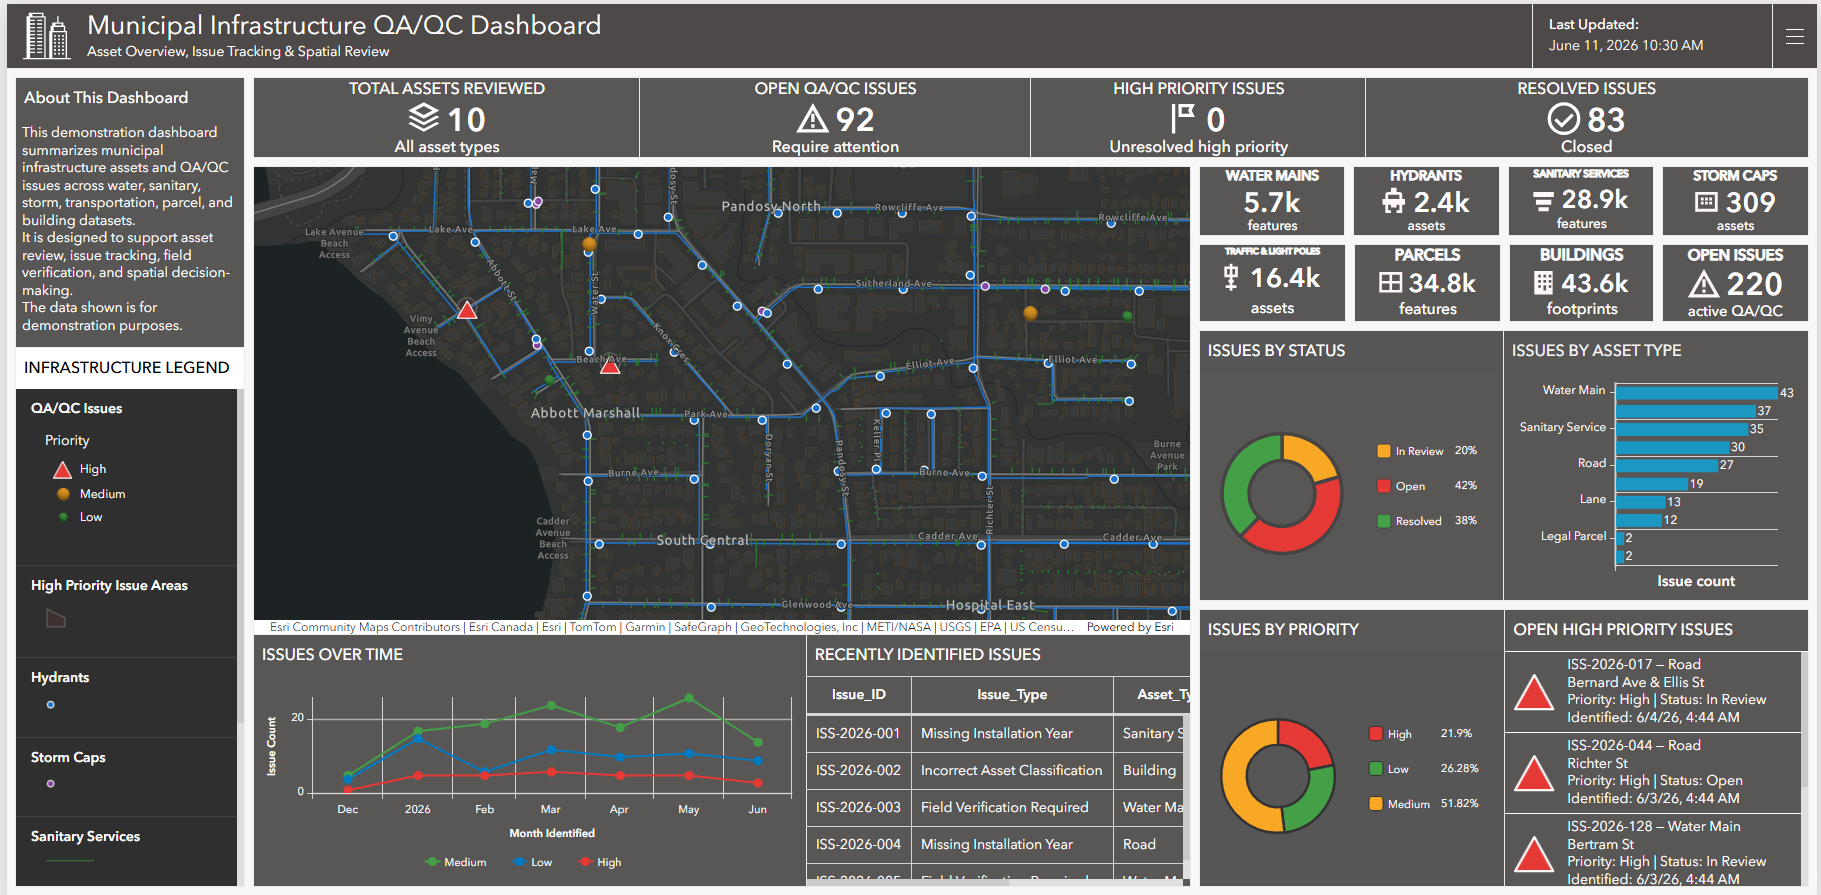
Dashboard-ready QA/QC workflow showing how municipal infrastructure layers and issue records can be structured, validated, symbolized, and reviewed through an interactive ArcGIS Dashboard.