
Dashboards, Reporting & Decision Tools
Interactive dashboards, reporting views, and decision-support tools that turn project data into clear, actionable information for better planning, monitoring, and management.
What This Service Helps with
Project teams often have the data they need, but not always in a format that is easy to understand or act on. Information may be spread across GIS layers, spreadsheets, field updates, asset records, project lists, inspection forms, or operational systems.
OrbitalIQ helps turn that information into dashboards and reporting tools that make project status, risks, priorities, locations, and trends easier to review.
This is useful when your team needs to:
Monitor project or asset status in one place
Track issues, risks, inspections, or maintenance needs
Summarize GIS and tabular data for managers or stakeholders
Visualize trends, priorities, and performance
Reduce manual reporting and repeated data lookups
Share clearer project information across teams
Typical Deliverables
ArcGIS Dashboards
Web maps and hosted feature layers
KPI indicators and summary cards
Project status dashboards
Asset review dashboards
Issue tracking dashboards
Inspection or field reporting dashboards
Charts, tables, and filtered lists
Data models for dashboard reporting
Cleaned and structured source data
Dashboard documentation or user guidance
Map-based reporting workflows
Core Support Areas
-
Custom dashboard layouts built around the way your team actually reviews information. Dashboards can include maps, indicators, charts, tables, lists, filters, and summary views.
-
Connection of GIS layers, spreadsheets, hosted feature layers, field data, asset records, and project tables into a clean reporting structure.
-
Clear summary cards for totals, counts, status, progress, priorities, backlog, resolved items, inspection results, or other metrics that matter to the project.
-
Filters, lists, tables, map actions, and selection tools that allow users to move from a high-level summary to individual records or locations.
-
Integration of web maps so users can see where assets, issues, inspections, constraints, or project activities are located.
-
Dashboard-ready summaries, charts, map views, and structured outputs that help teams communicate information more clearly.
Example Use Cases
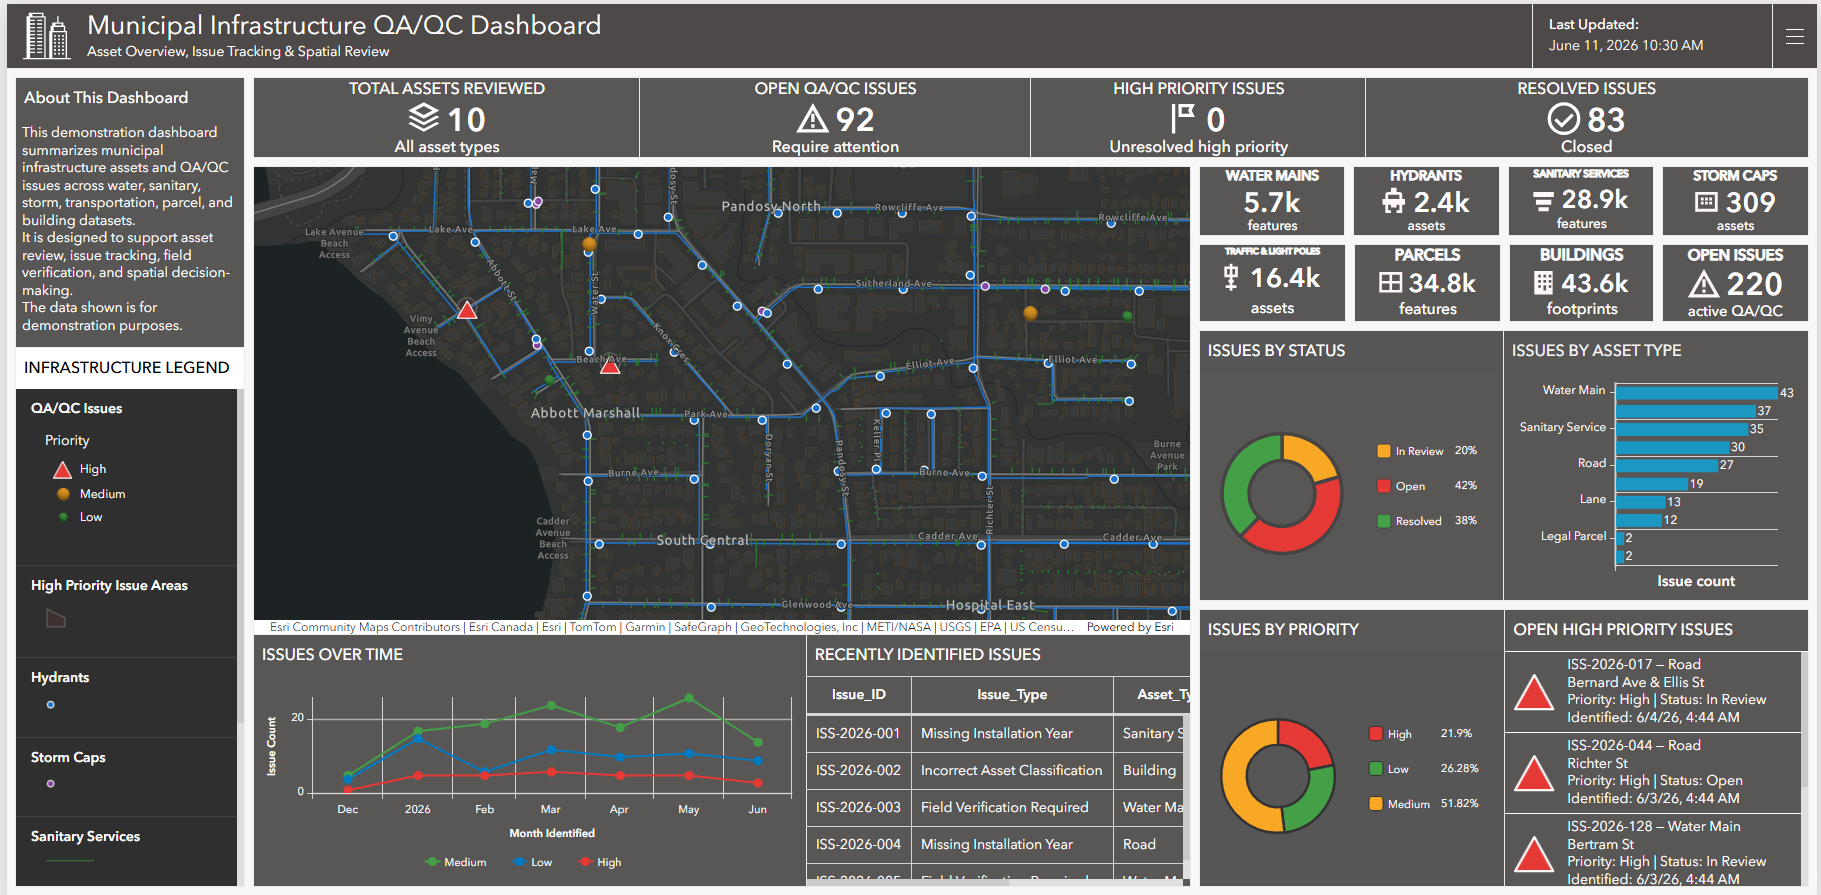
Municipal Infrastructure Review
Dashboards for reviewing infrastructure assets, QA/QC issues, inspections, maintenance needs, and field verification records.
Public-Sector Reporting
Decision-support dashboards for programs, projects, service areas, operational priorities, and stakeholder reporting.
Environmental & Field Workflows
Dashboards for tracking field observations, inspection status, environmental features, monitoring records, or site-level updates.
Development & Land Analysis
Reporting views for parcels, constraints, suitability scoring, development sites, infrastructure context, and planning-related datasets.
Resource & Natural Environment Projects
Dashboards for terrain, forestry, recreation, exploration, environmental, or land-based information that needs to be summarized spatially.
Related Project Example